The Weekly Index Blueprint: Nifty & Bank Nifty Price Action
A recurring deep dive into the technical structure, critical zones, and underlying momentum driving India's benchmark indices for the week ahead.
Welcome to the first edition of our Weekly Market Wrap. As the markets close for the week, it's essential to step back and analyze the broader structure before diving into individual setups.
This week saw significant volatility, driven by global macroeconomic cues and local institutional flows. In this post, we'll break down the technical structure of the Nifty 50 index across multiple timeframes, outline key levels to watch, and decode the current trend dynamics.
Nifty 50 Technical Analysis: Weekly & Daily Chart Outlook
On the weekly chart, Nifty 50 has been consolidating within a massive Rectangle Pattern over the past 2.2 years, actively trading inside a 20% range between the 26,353 ceiling and 22,000 base. Currently, the index continues to fluctuate in the middle of this multi-year range.
Recently, the chart established a very strong resistance barrier around the 24,500 level. While the recent candle printed a bearish body, it formed a prominent lower wick shadow, demonstrating active buying interest and lower-level absorption.
A sustained bullish breakout above 24,500 will be key to unlocking further upside momentum on the weekly timeframe. On the downside, a slip below the 23,000 level could trigger a move back toward 22,000, which serves as a major, high-probability support zone.
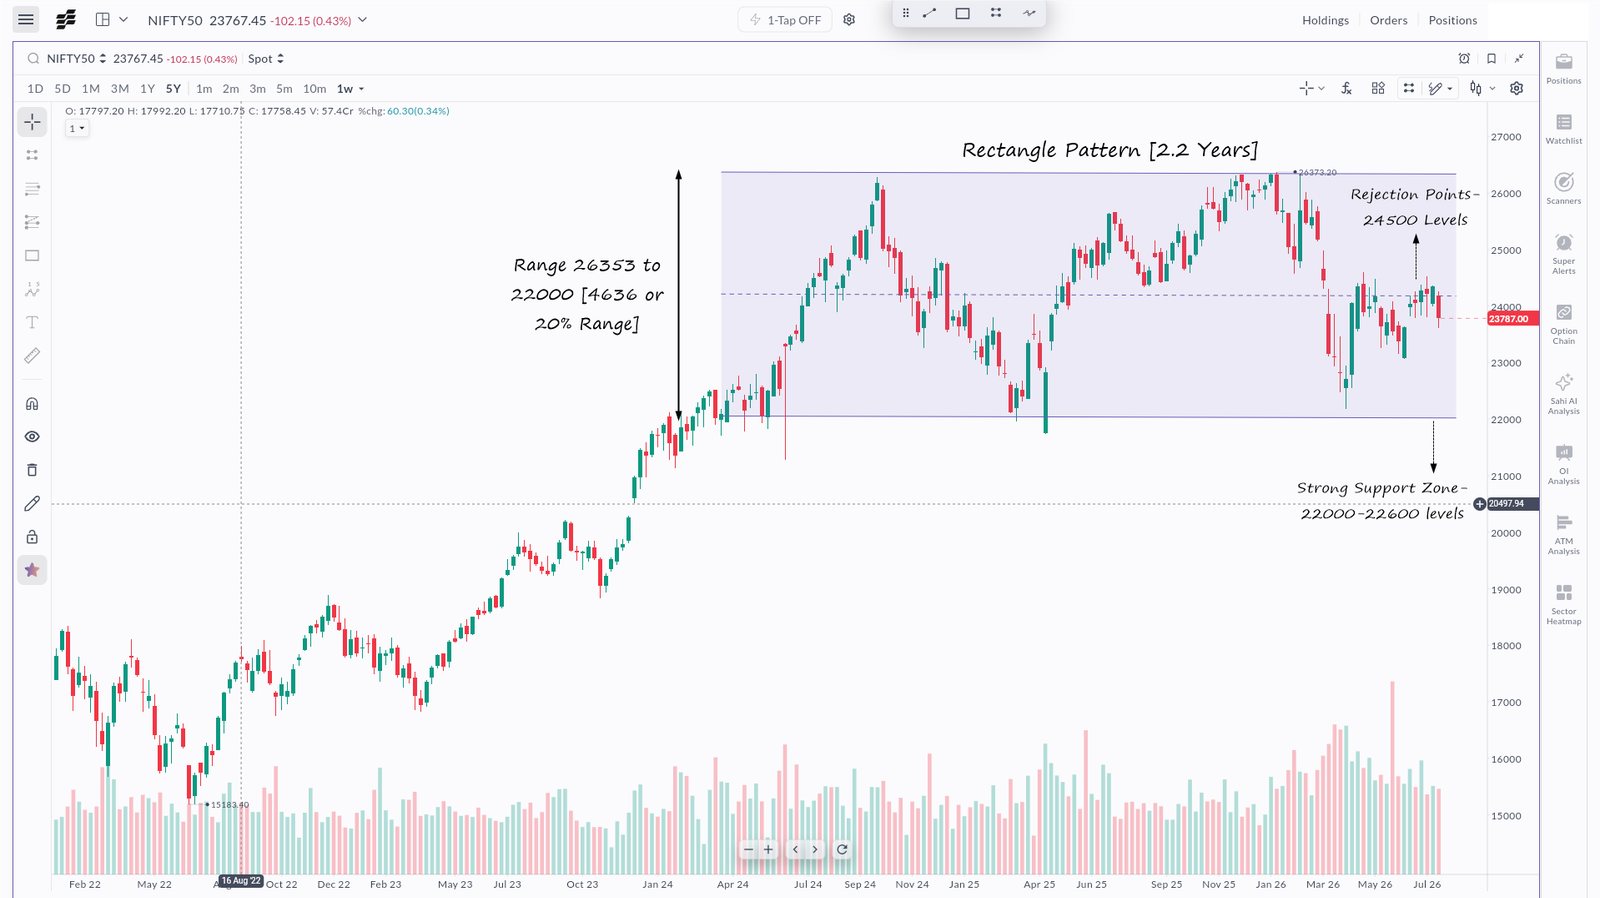
Nifty 50 Weekly Chart - 2.2-Year Rectangle Pattern & 24,500 Resistance Zone
Professional Tip
In a multi-year consolidation range, the edges (support and resistance) provide the highest probability trading opportunities. Avoid getting chopped up in the middle of the range.
Zooming into the daily timeframe, the index is trading within a well-defined Ascending Triangle pattern. The price continues to consolidate tightly within this contracting range.
On Friday, despite opening with a gap down, the index found strong support and formed a constructive bullish candlestick. This indicates that buyers are aggressively stepping in at lower boundary levels to defend the structure.
Looking ahead, a decisive break above the 23,850 - 23,900 resistance zone would signal a short-term reversal, potentially driving the index toward the 24,200 - 24,500 levels. The ultimate breakout level remains at 24,500—a sustained close above this major resistance could unlock a strong upside rally.
Conversely, if the index breaks and sustains below the critical 23,600 support level, it would invalidate the bullish structure and likely trigger a sharp fall on the downside.
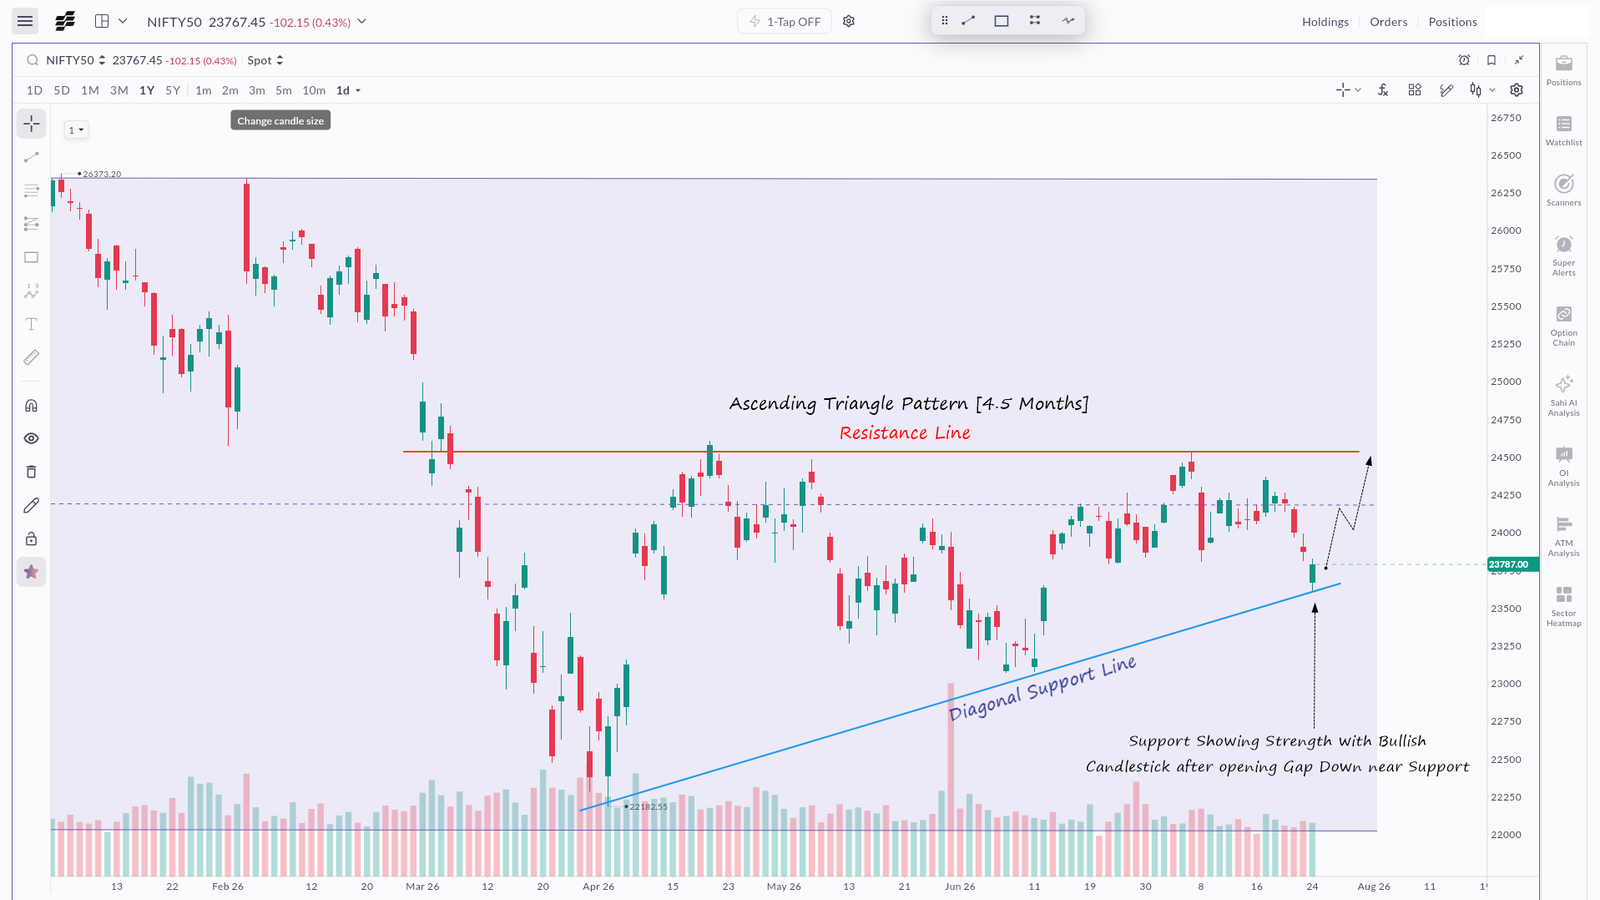
Nifty 50 Daily Chart - Ascending Triangle & Key Breakout/Breakdown Levels
Critical Nifty 50 Levels
Major Breakout
24,500
Sustained close above unlocks strong upside rally.
Short-term Reversal
23,850
Breaking this zone signals early momentum shift.
Key Support
23,600
Breakdown invalidates bullish structure, triggering fall.
Major Base
22,000
Ultimate long-term support floor.
Bank Nifty Technical Analysis: Rising Wedge Structure
Shifting our focus to the banking heavyweight, Bank Nifty on the daily timeframe is currently negotiating a prominent, multi-month Rising Wedge pattern. This structure has been meticulously guiding the index's trajectory, characterized by higher highs and higher lows that are slowly converging, indicating a gradual exhaustion of bullish momentum.
However, the immediate price action offers a fascinating setup for the bulls. The index recently experienced a sharp retracement right into the lower diagonal support boundary of the wedge. Exactly at this critical juncture, the daily candle printed a textbook 'Piercing Pattern'—a potent two-candle reversal formation where a long bullish body pierces deep into the preceding day's bearish body, signaling aggressive institutional defense of the support zone.
From this heavily defended zone, the immediate resistance is clearly marked at the 57,000 level. If Bank Nifty can summon the momentum to decisively cross and, more importantly, sustain above this 57,000 threshold, it would invalidate the immediate bearish threat. Such a breakout would unleash trapped short-sellers, sparking a short-covering rally that could rapidly propel the index toward the 58,000 and eventually the 59,000 levels in the coming sessions.
Conversely, traders must respect the inherent bearish bias of a Rising Wedge. If the bulls fail to capitalize on the piercing pattern and the index slips back down to break the 56,000 structural support, the setup turns highly toxic. A sustained daily close below 56,000 would technically confirm a Rising Wedge breakdown, trapping recent buyers and likely triggering a severe, high-velocity liquidation cascade toward the 54,000 - 53,000 foundational support levels.
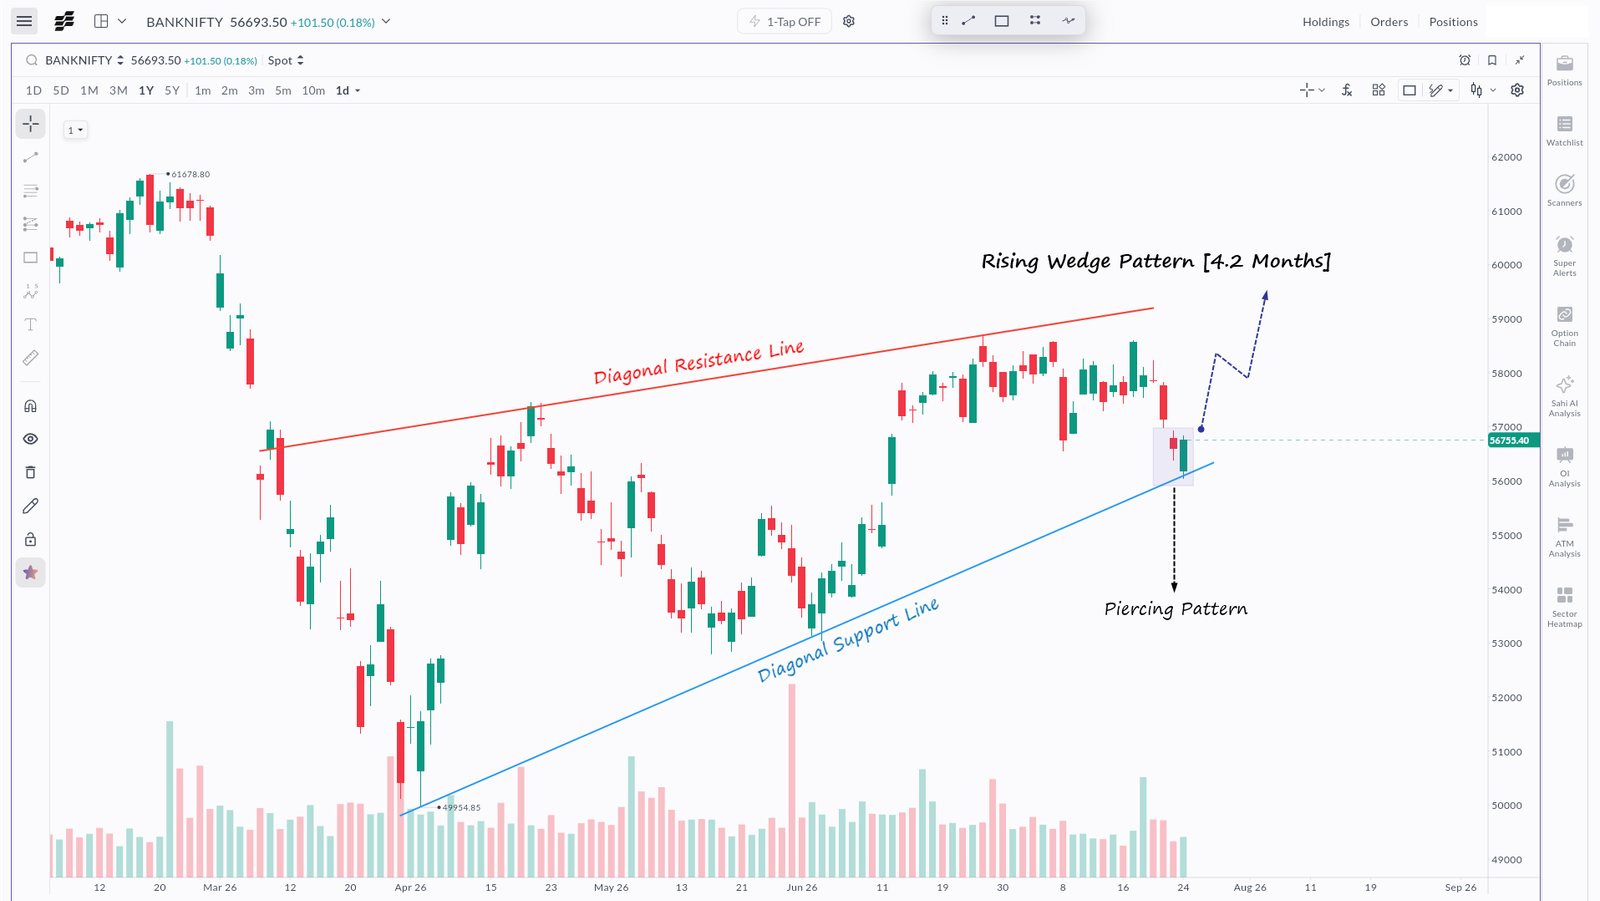
Bank Nifty Daily Chart - 4.2 Month Rising Wedge & Piercing Pattern at Support
Critical Bank Nifty Levels
Bullish Breakout
57,000
Sustained crossing unlocks massive 58k-59k upside rally.
Wedge Support
56,000
Critical diagonal trendline holding the structure.
Major Breakdown
56,000
Close below this level triggers a severe fall.
Downside Target
54,000
Immediate support zone following a wedge breakdown.
In a Rising Wedge, the lower trendline is the line in the sand. A piercing pattern at support offers a high-reward entry, but a breakdown turns it into a high-velocity trap.
Professional Tip
When trading a bounce off a Rising Wedge support line, keep your stop-losses ruthlessly tight. The structure inherently carries a higher probability of a downside breakdown, so you are technically fighting the longer-term pattern bias.
Critical Warning
A breakdown of a multi-month Rising Wedge often leads to a rapid, high-momentum sell-off. Do not pre-empt a bounce if the 56,000 support is convincingly broken.
What's Next?
Trade the setups discussed with proper position sizing. Check out our latest Chartbook for individual stock breakouts.
Explore More ResearchInvestment in securities market are subject to market risks. Read all related documents carefully before investing. Registration granted by SEBI and certification from NISM in no way guarantee performance of the intermediary. Content is for educational purposes only and should not be considered as financial advice.