Indicators, Metrics & Strategies
Your complete technical analysis toolkit — from moving averages to Pine Script.
Mr. Chartist Workflow
Read with a trading desk mindset.
Every TradingView article now follows a practical pattern: understand the tool, map it to a charting workflow, apply it on Indian market instruments, and turn it into a repeatable workspace habit.
5
Sections
5m
Read
chart
Level
Open a clean chart and locate the exact TradingView area covered in "Indicators, Metrics & Strategies".
Apply it on one liquid NSE stock, one index, and one weekly timeframe so the concept is not learned in isolation.
Save the layout, write one note about what improved your decision-making, and remove anything that adds noise.
TradingView hosts the largest technical analysis library on Earth, boasting over 400+ built-in indicators and a staggering 100,000+ community-developed scripts. From classical Moving Averages to cutting-edge AI pattern recognition, the analytical toolkit is virtually limitless.
However, access to limitless tools often leads to 'analysis paralysis'. The hallmark of an institutional trader is not how many indicators they use, but how deeply they understand the specific mathematical edges of the few they deploy. In this guide, we break down the difference between visual indicators, backtestable strategies, and the Pine Script ecosystem.
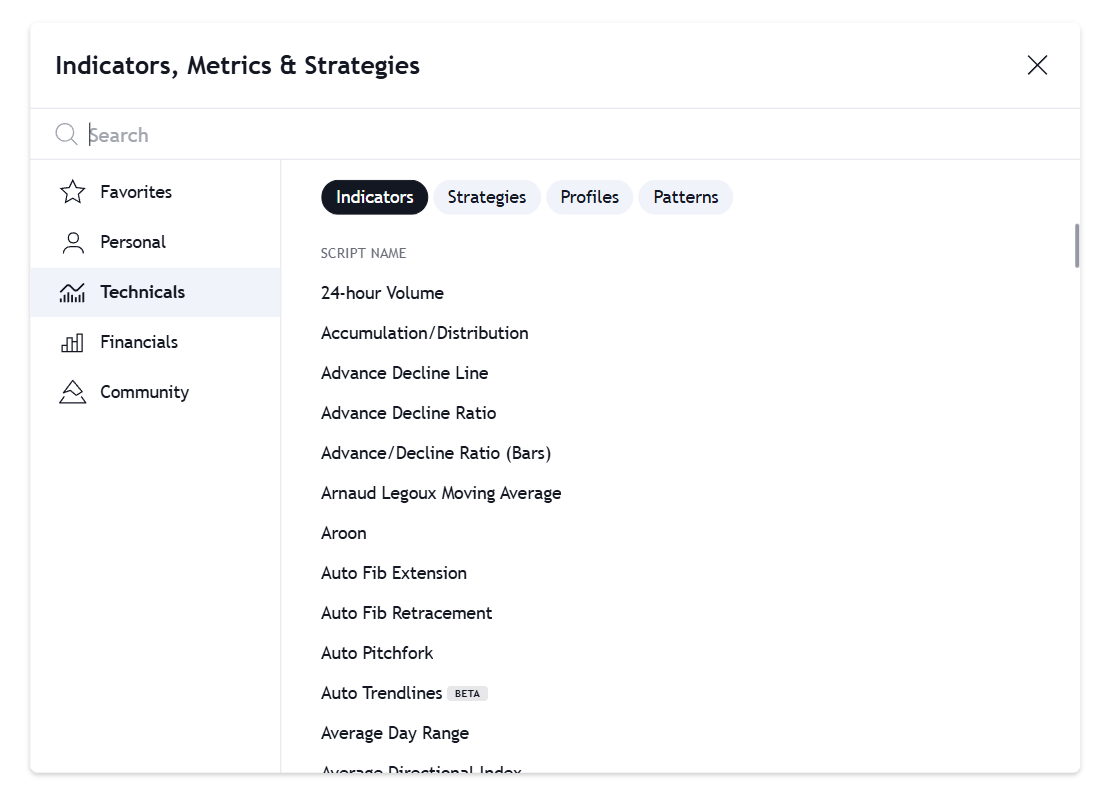
1. The Technical Library: Visualizing Data
Indicators are mathematical formulas applied to historical price and volume data. Their sole purpose is to visualize market trends, momentum, and volatility to help you identify high-probability setups.
TradingView allows for deep customization. You can change lengths, colors, and visibility per timeframe. More importantly, paid plans unlock 'Indicator on Indicator' functionality. Instead of applying an RSI to the price chart, you can apply a Moving Average directly onto the RSI line to smooth out its momentum signals.
Snapshot & Takeaways
Professional Tip
Press the '/' key on your keyboard while viewing a chart to instantly open the unified 'Indicators, Metrics & Strategies' search window.
Official Resources
2. Indicators vs. Strategies: The Core Difference
The most common point of confusion for new TradingView users is the difference between an 'Indicator' and a 'Strategy'. While they look similar in the search menu, they serve entirely different computational purposes.
An Indicator (written using the `indicator()` function in Pine Script) simply plots lines or shapes on the chart. It cannot execute trades or calculate historical performance.
A Strategy (written using the `strategy()` function) contains explicit Buy and Sell logic. When applied to a chart, it sends simulated orders to a broker emulator. This automatically generates a comprehensive Backtest report in the 'Strategy Tester' tab, revealing the true Win Rate, Profit Factor, and Maximum Drawdown of the system.
Visual Indicators
- Plots data visually (lines, histograms).
- Used for discretionary trading and manual analysis.
- Can trigger simple price/condition alerts.
Algorithmic Strategies
- Executes simulated Buy/Sell orders.
- Generates full historical equity curves and win rates.
- Used for quantitative backtesting and algorithmic automation.
Critical Warning
Do not blindly trust the 'Win Rate' of community strategies. Poorly coded scripts can 'repaint' (change past signals based on future data), creating an artificially perfect equity curve that will destroy capital in live trading.
3. The Public Library & Script Types
TradingView's proprietary programming language, Pine Script (currently version v6), powers the entire platform. Users have published over 150,000+ scripts to the Public Library, which are categorized into three distinct access levels:
Open-Source Scripts
- Source code is fully visible.
- Anyone can copy, modify, and learn from the code.
- Forms the backbone of the TradingView community.
Protected Scripts
- Free to add to your chart and use.
- Source code is hidden to protect the author's intellectual property.
- You cannot modify the underlying math.
Invite-Only Scripts
- Locked scripts that cannot be added without the author's permission.
- Often used by commercial vendors selling proprietary trading systems.
- Requires a Premium plan to publish.
4. The Indian Market Institutional Toolkit
When trading highly liquid Indian indices like Nifty 50 and Bank Nifty, institutional traders rarely use exotic, unproven indicators. Instead, they rely on a confluence of high-timeframe structural tools combined with volume-weighted data.
Below is the standard 'Institutional Flow' combination frequently used for intraday index trading:
VWAP (Volume Weighted Average Price)
- The ultimate intraday benchmark.
- Price > VWAP = Institutional Buying Control.
- Price < VWAP = Institutional Selling Control.
RSI Divergence (14)
- Used strictly to identify exhaustion.
- Wait for price to make a new high while RSI makes a lower high (Bearish Divergence) before fading a move.
SMC (Smart Money Concepts)
- Community scripts that highlight Order Blocks (OB) and Fair Value Gaps (FVG).
- Identifies hidden liquidity zones where large banks left unfilled orders.
Avoid 'Indicator Hell'. Plotting 10 different indicators will result in analysis paralysis. A professional chart uses a maximum of 2 to 3 indicators that provide non-overlapping information (e.g., one for Trend, one for Momentum, one for Volume).
5. Financials & Fundamental Overlays
TradingView is not just for technical analysts. Fundamental investors can overlay over 100+ corporate financial metrics directly onto the price chart.
By searching the 'Financials' tab, you can plot metrics like the P/E Ratio, Total Revenue, or Free Cash Flow as a line directly beneath the candlestick chart. This allows swing traders to visually correlate price breakouts with actual earnings acceleration, bridging the gap between technical timing and fundamental conviction.
Unlock TradingView Pro
Gain unrestricted access to multiple charts, custom timeframes, and unlimited technical indicators to perfect your edge.
Frequently Asked Questions
Common questions about this topic
An Indicator only calculates and visualizes data on the chart (like a Moving Average line). A Strategy contains programmed Buy and Sell execution logic, allowing the TradingView 'Strategy Tester' to simulate trades over historical data and calculate your exact Win Rate, Profit Factor, and Drawdown.
Official TradingView Resources
Curated links from TradingView's Help Center & Blog
How do I remove or customize an indicator?
To remove an indicator or see its settings, open the chart legend by clicking the arrow button under the symbol name:Complete the following steps afte...
How do I hide/display an indicator in the iOS app?
To change the visibility of the indicator, you need to click on the eye icon in the legend under the ticker name:...
Time Price Opportunity (TPO) indicator
With the Time Price Opportunity (TPO) indicator, also known as "Market Profile," you can analyze market activity by price level as it develops over ti...
Session Time Price Opportunity (STPO) indicator
DefinitionThe Session Time Price Opportunity (STPO) indicator creates TPO profiles for each day based on the sessions specified in the settings, allow...
18th stable version of the Charting Library for Technical Analysis & Trading Platform
Read fresh TradingView updates: 18th stable version of the Charting Library for Technical Analysis & Trading Platform. Discover more in our blog and stay connected with the latest platform news.
2020: big leaps forward for Pine and indicators
Read fresh TradingView updates: 2020: big leaps forward for Pine and indicators. Discover more in our blog and stay connected with the latest platform news.
The new built-in Pine indicator — Auto Fib Extension
Read fresh TradingView updates: The new built-in Pine indicator — Auto Fib Extension. Discover more in our blog and stay connected with the latest platform news.
Auto Fib Retracement — the New Pine Indicator
Read fresh TradingView updates: Auto Fib Retracement — the New Pine Indicator. Discover more in our blog and stay connected with the latest platform news.
Related Articles
Continue your learning journey
Chart Types — Complete Guide
From candlesticks to Heikin Ashi — choosing the right visualization for every analysis.
ModuleCompare Feature & Overlay Analysis
Relative strength, correlation analysis, and pairs trading using the Compare tool.
ModuleCreating Alerts — Never Miss a Trade
Price alerts, indicator alerts, webhooks, and the complete alert automation system.
ModuleIntroduction to Pine Script
The basics of TradingView's proprietary programming language for building custom indicators.

Written By
Rohit Singh
Mr. Chartist
With 14+ years of experience in Indian financial markets, Rohit Singh (Mr. Chartist) is a SEBI Registered Research Analyst, Amazon #1 bestselling author, and the founder of Investology — a premium trading ecosystem trusted by a 1.5 Lakh+ strong community across India.
TradingView is a registered trademark of TradingView, Inc. All screenshots, logos, and platform imagery are the property of TradingView, Inc. and are used here for educational purposes only under fair use. This content is not affiliated with, endorsed, or sponsored by TradingView.
(c) 2026 TradingView, Inc. All rights reserved. - www.tradingview.com